In the third part of the financial foundations series we discussed Revenue Cost Ratios, or how much is invested for each dollar of revenue. For new customers this is your Customer Acquisition Cost (CAC). For existing customers these are your Customer Retention Costs (CRC) and your Customer Expansion/Upsell Costs (CEC/CUC). Part 4 of this series continues discussing revenue ratios and explains why they are of critical importance to customer success (CS) executives.
Determining Your Ratios: Since revenue ratios are unique to your company, establishing them can be challenging. This begs the question… Where do you start? The first thing to do is to determine your current ratios and start to track and report on them regularly. Once done, the next step is to establish target ratios. Selecting targets is inherently complex, but since establishing them is critical, consider an approach that many find useful and start with ratios based on benchmark data such as that provided in the figure below[1].
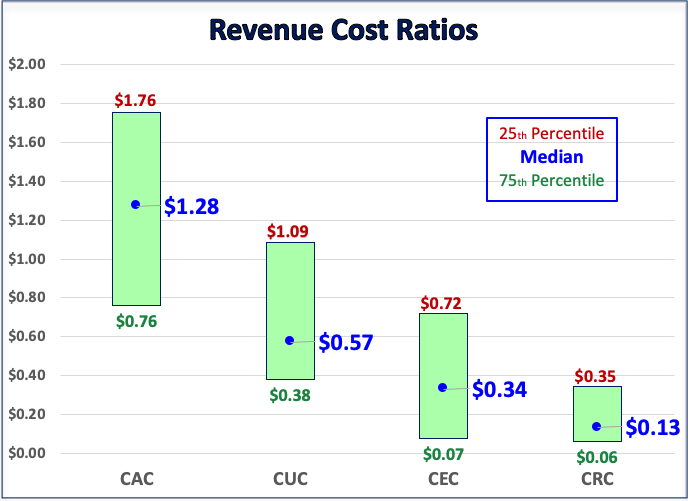
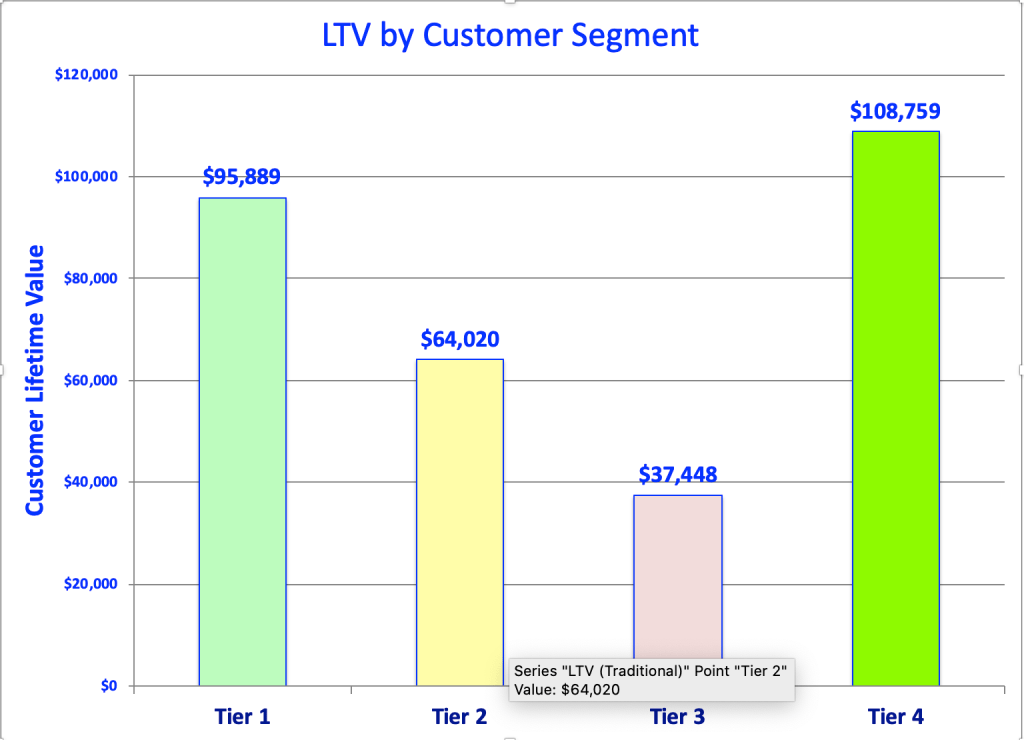
Why CRC Ratios Are Critical to Establish: CRC ratios are critical because they define how to best use your CS resources. Agreeing upon on a CRC ratio enables you to establish your headcount, understand when it’s time to invest in technology, determine the skill set needed by your next hires, and optimize customer journeys and playbooks. As an example, a CRC ratio can be used to optimize the allocation of your resources based on the “value” of a group of customers. One approach to doing this is to segment your customers based on their Average Revenue Per Account (ARPA). Simply put, this approach assures that the customers paying you the most, receive the most attention. To illustrate this let’s assume the appropriate CRC ratio for your company is $0.13 and that your top tier customers have an ARPA of ~ $50,000 while your Tier 4 customers have an ARPA of ~ $11,000. If you allocate resources proportionately, you would spend ~ $6,600 per year on each Tier 1 customer and ~ $1,400 on each Tier 4 customer. This insight allows you to define or refine your customer journey and playbooks and dedicate resources appropriately. This way to “value” your customers makes sense at an intuitive level, but there are other factors to consider when establishing customer segments. The “value” decision is impacted by a lot of factors such as their potential for increased future revenues (land & expand), or the role they play in penetrating new markets. One consideration that may be appropriate for your company is Customer Lifetime Value (LTV). The data in the chart below shows how this might influence your CS tactics. As stated above, when segmented by ARPA, the Tier 1 customers should have received ~$6,500 and Tier 4 ~$1,400. This seems reasonable, but when you look at the LTV analysis below, this allocation strategy comes into question since the Tier 4 customers have the greatest LTV.
Why Targets for CEC and CUC are Critical: So far, we have focused on retention costs, but even when gross retention (churn) is the most important issue facing your team today, this focus will shift. The natural shift from gross churn to net is supported by data provided annually by KBCM (formerly Pacific Crest Securities) in the chart below[2].
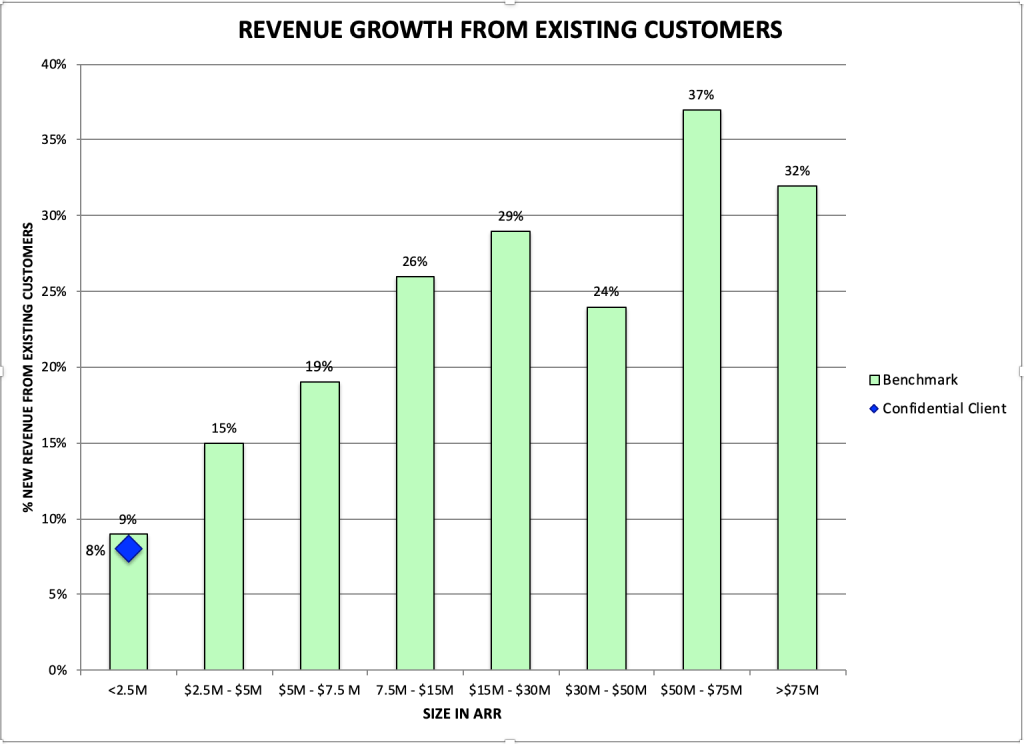
The reality is that very few (if any) companies have 0% gross churn, nor should they. Consider the LTV by Tier chart above. The value of Tier 3 customers is lower than any other segment. This fact should bring into question the amount invested in them relative to the cost of retaining them. If the customer success resources you have can be better used elsewhere, the increase in churn may be acceptable. The shift in focus from gross to net retention with some level of churn is supported by other KBCM data as well. According to their research, in 2018 the median gross dollar churn rate for 272 private SaaS companies was 12.7%. For these same companies the net dollar retention was 102.7% emphasizing the importance of revenue growth from your customers.
This shift in focus underlines the importance of establishing CEC and CUC ratios. As for why CS should be involved… Consider that the percent of companies who pay full commission for expansion and upselling continues to decrease. In 2018, 53% of the companies surveyed by KBMC paid full commissions for upselling. The number for 2017 was 68%. The fact that a decreasing number of companies are using their salesforce to drive revenue expansion from existing customers is of particular interest to customer success. This shift makes it important for CS executives to understand how this will impact their team in the future. By looking at both CEC and CUC ratios, CS executives can better plan for the number and type of resources they will need going forward. History has shown that a failure to plan for the evolution of your customer success team has led to both the turnover of CS executives and sometimes the entire organization. By looking at the benchmark data above, it is easy to see that a dollar of expansion costs more than two and a half times as much as a dollar of retention. This increased cost needs to be factored into the cost of CS organizations. When customer success owns or takes partial responsibility for revenue expansion the increased cost to the organization is often overlooked causing challenges with existing retention performance or missed commitments for revenue expansion.
Final Thoughts: Everything written above often strikes people as complex, but in reality, it is an oversimplification. Retention efforts are rarely solely focused on retention since customer success helps customers achieve and recognize the value a company provides. This contributes to brand building, customer marketing that helps close deals, and advocacy efforts that provide a source of pipeline. As such CRC, CEC, CUC and even CAC are not independent. Although this complexity and interdependence exists, it should not result in the failure to establish these critical ratios. Ultimately these challenges do not undermine the value to be gained from creating target ratios, but rather necessitates it.
[1] Data collected by The Successful Customer over the past 5 years from both public and private SaaS companies.
[2] 2019 KBMC SaaS Private Survey Results, https://www.forentrepreneurs.com/

0 comments on “The Financial Foundations Series… Understanding Revenue Cost Ratios”